Since there is a wide range of approaches to education, it would be unrealistic for math teachers to depend on just one. Researchers have shown that there are more than seventy different learning styles, with visual, auditory, verbal, and kinesthetic (also known as VARK) methods serving as the primary modes of sensory processing.
Studies have shown, which is rather interesting, that visual learners make up 65 percent of the total population. Because of this, it is critical for educators who want their students, particularly youngsters, to have a greater engagement with the mathematical subject they teach to understand the demands of visual learners.
Concept of Visual Learning
The interaction and processing of information via images are what we call “visual learning.” This comprises a variety of different sorts of visual aids such as drawings, photographs, charts, graphs, and maps.
Teachers may utilize chalkboards, whiteboards, screens, projectors, and other methods for showing visual information to interest students who learn best via seeing things. They can also use these methods to assist students in learning and retaining what they see.
Visual learners can acquire knowledge via other channels, but the “show me” method is the most effective. For instance, it is more effective for them to see someone else changing a flat tire than reading the directions in a handbook.
Even when instructions are given, it might be challenging for someone who is a visual learner to comprehend the information if contrasted to gazing at a map.
Benefits of Visual Learning
Using visual representations in teaching and learning mathematics is helpful for both pupils and instructors in several studies. The use of various models, in general, is a crucial component of the mathematical expertise of instructors. These representations themselves can play an essential part in clarifying mathematical concepts.
The use of external representations may help bring attention to certain facets of a mathematical topic, and bolsters the process of explanation. In addition, being able to draw from various graphical representations is an essential component of students’ mathematical comprehension.
Students can create links between their personal experiences and mathematical concepts via visual representations, which enables them to acquire insight into the more abstract aspects of mathematical ideas.
Some of the exciting benefits are mentioned below:
1. Enhance Engagement In An Effective Manner

Learning may become more enjoyable when pictures are included in the process in some way. When attention spans are at an all-time low, educators must find ways to keep their pupils interested for extended periods.
According to recent research, the typical human has an attention span of about eight seconds. If the class does not begin with pictures that are captivating and applicable to the students, it will be straightforward for the teacher to lose their attention.
2. Inspire Students To Think Outside Of The Box

Students have a more imaginative approach to problem-solving thanks to visual learning. Students apply this knowledge to various elements of their life outside the classroom.
Consider the most recent instance where you couldn’t find anything in the home. You may have attempted to solve the challenge visually by shutting your eyes and visualizing the object’s location while searching for it.
Visual issue solving is when you imagine the steps you took the last time you remembered having something, like your keys. When you do this, you are engaging in visual problem-solving.
3. Best Way To Retain Knowledge
The ability to see something makes it easier for many people to remember it than to read or listen to it. Processing and storing the information in visuals is more straightforward because it is provided in manageable portions.
When students use online education platforms that break complicated concepts down into short films, for instance, it enables them to absorb the information in short, digestible sessions rather than having them read a lengthy chapter in text format.
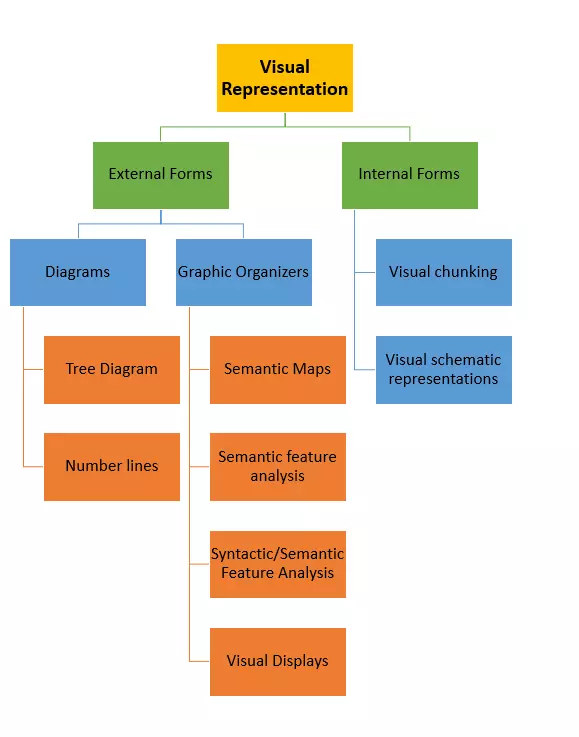
Various Forms of Visual Representations
When speaking about visual representation in mathematics, you may be referring to putting information on paper with a diagram or chart or referring to the front representing information in your brain with an image.
Researchers have, thankfully, been concentrating their efforts on finding ways to assist pupils in improving their visual representations, both internally and outwardly.
Students need to develop internal and external visual representation techniques since both help support student learning in mathematics for various issues. This is because both help support student learning in mathematics.
In addition to the differentiation researchers have made between internal and external visual representations, they have also defined distinctions in visual imagery dependent on the function of the imagery. The visual appearance of things or information may be represented pictorially via several types of imagery. Representing the spatial connections between objects or information may be accomplished via schematic imagery.
Schematic imagery is a more effective way of enhancing students’ ability to solve mathematical issues, even though both may be utilized to assist students in learning and solving problems in mathematics. Mathematical problem-solving is often facilitated by using graphical representations among students with learning difficulties.
External Forms of Visual Representations
Both diagrams and graphic organizers are examples of external visual representations that are employed in mathematics. The use of both of these forms of words with children who have learning disabilities is supported by research.
Because it can be seen on paper or the board in front of the class, this visual representation may be modeled for students. Additionally, it can be shown at the front of the course.
- Diagrams
- Graphic organizers
Types Of Diagrams
Mathematical difficulties may often be represented visually using diagrams, which use the problem’s relevant information. In most cases, they illustrate how significant pieces of information are connected.
Additionally, they may be used to organize information and calculate the solution to a problem. A diagram a student draws to illustrate the concepts presented in a word problem is an example of a typical Venn diagram.
Following are the examples of diagrams:
1. Tree Diagram
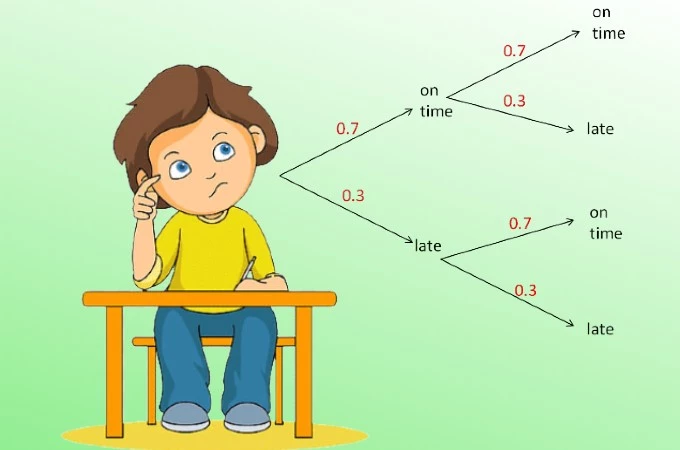
In the context of teaching students about probability theory, a tree diagram shows separate occurrences or circumstances associated with an action. Tree diagrams are often used in classroom settings.
Students might learn about probability by tossing a coin or drawing from a deck of cards using this graphic as a teaching tool. It is an excellent example of a visual representation that is a diagram, and it is widely recognized as an effective strategy for teaching students the mathematical concept of probability.
2. Number lines
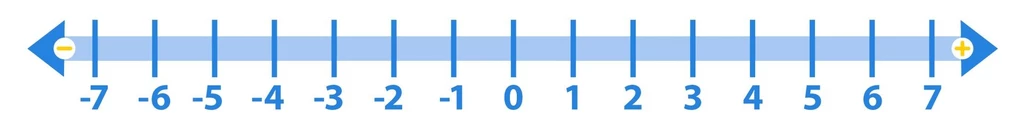
A number line is another kind of diagram that mathematicians are starting to use more often. Students may create a number line and utilize it as a tool for problem-solving purposes. A number line contains a straight line with numbers written along it at evenly spaced locations.
Because they offer students a visual they may touch to maintain track of their location while solving elementary addition and subtraction problems; number lines are often employed for teaching integers. They are also used while teaching essential addition and subtraction issues.
Types of Graphic Organizers
Another kind of external visual representation that is often used in the field of mathematics is known as a graphic organizer. There are various kinds of graphic organizers, and each has a particular set of circumstances in which it functions most well.
Even though graphic organizers are often considered to be nothing more than simple organizing tools, one may utilize them to draw quick inferences to tackle various difficulties. There are four main types of graphic organizers. Let’s have a look at them.
1. Semantic Maps
One kind of visual organizer that may be put to use to facilitate learning in mathematics better is called a semantic map. The primary purpose of this kind of graphic organizer is to link conceptual knowledge, and it has the potential to be utilized to promote conceptual learning in mathematics.
2. Semantic Feature Analysis
An additional sort of graphic organizer is referred to as a semantic feature analysis. This visual organizer is distinguished by its use of a matrix format, which allows for the presentation of various qualities or characteristics of things or ideas. In geometry, comparing forms may be accomplished via semantic feature analysis, in which comparisons may be made between the number of sides, vertices, kinds of angles, etc.
3. Syntactic/Semantic Feature Analysis
A syntactic/semantic feature analysis is very similar to a semantic feature analysis; the only difference is that words are included in the analysis to assist students in recognizing the specific characteristics of each item.
4. Visual Displays
In mathematics, a visual display is a graphic organizer that may present spatial connections in a highly understandable manner. Visual displays are versatile tools that may be used for various diverse uses. One may use a Venn diagram to compare different things or ideas or a timeline to present information chronologically to determine the solution to a word issue.
Internal Forms of Visual Representations
Internal visual representation is more of a mental exercise than something easily shown to pupils in the same way external visual representation can be taught to them. Producing or recalling graphical images to represent information is the focus of a visual schematic representation.
Students are often prompted to form a mental image of the issue to comprehend it better and find a solution. It is not safe to assume that all students already have this ability since it is a task that students may find challenging, and it is also not safe to take that all students already possess this competence.
When solving a word problem in mathematics, students must blend information from the issue with previous knowledge they already possess to generate a mental image. Even though students cannot see the mental pictures their teachers are creating, it is still possible to guide students through the procedure of creating the mental image as a verbal model or even to have students draw pictures of what they see in their heads to make it more explicit.
Following are the two types of internal forms of visual representations:
1. Visual Chunking
The term “visual-chunking representation” refers to the approach instructors might use to assist their pupils in developing internal visual representations. The technique of merging pieces of information connected in some manner to
2. Visual Schematic Representations
It has been shown that visual schematic representations are helpful for those with unique difficulties in mathematics, which might include learning disabilities. Training pupils to develop internal graphical models may be challenging since the topic does not lend itself well to explicit instructional methods.
Despite this difficulty, instructors can still assist students in developing this talent by having students draw diagrams of their mental representations and encouraging students to verbalize their thoughts as they visualize solutions to problems.
Conclusion
In many fields of study, including mathematics, using visual representations throughout the teaching and learning processes is common practice, which is often considered a successful method. Visual representation as an instruction technique does yield considerable learning advantages for students in mathematics; however, these improvements are significantly more considerable when other methods of instruction are utilized in addition to visual representation.
It is advised that pupils convey mathematical material visually, vocally, and in textual form.